Your vault, as a graph
you can actually read
A replacement for Obsidian's Graph View built for 5,000–50,000 notes, where the default graph turns into a hairball. WebGL rendering, PageRank, clusters and usage tracking turn the graph into an analysis tool instead of a decoration.
Built for vaults that outgrew the default graph
Every node carries real signal — how often you open it, how it ranks, when it last changed — and you decide what that signal means visually.
Metric-driven encoding
Map PageRank, open frequency, edit recency, note age, link counts, folder or tag to size, color or glow.
WebGL rendering
Pixi.js v8 keeps 10,000+ nodes above 50 FPS. Force layout runs off the UI thread in a Web Worker.
Usage tracking
A fully local log of note opens, bucketed by day. Export to CSV or wipe it any time.
Clusters
Louvain community detection with automatic TF-IDF naming, cluster bubbles, per-cluster zoom and hide.
Overlays & diagnostics
Orphans, dead ends and broken links surface with live counters — plus an attention map for cooling hubs.
Search & filters
Native graph syntax plus opened:>10, edited:<30d, cluster:"name" and more, with saved presets.
Focus mode
Double-click a node to see only its N-hop neighborhood, with distance-based fading.
Timeline & session trail
Watch the vault grow month by month, then retrace your own navigation path with animated arrows.
Export
Current view as PNG, graph data as JSON or GEXF for Gephi, settings as a portable profile.
Explore mode
Travel the graph one link at a time, No Man's Sky style: point toward a link, click, and the camera flies to the note at the other end.
Aiming is by direction, not by pixel — a hub with fifty overlapping links stays navigable. Nothing moves on hover alone; every trip is a deliberate click.
Backspace retraces the trail, Space lets go of the current note, Esc leaves.
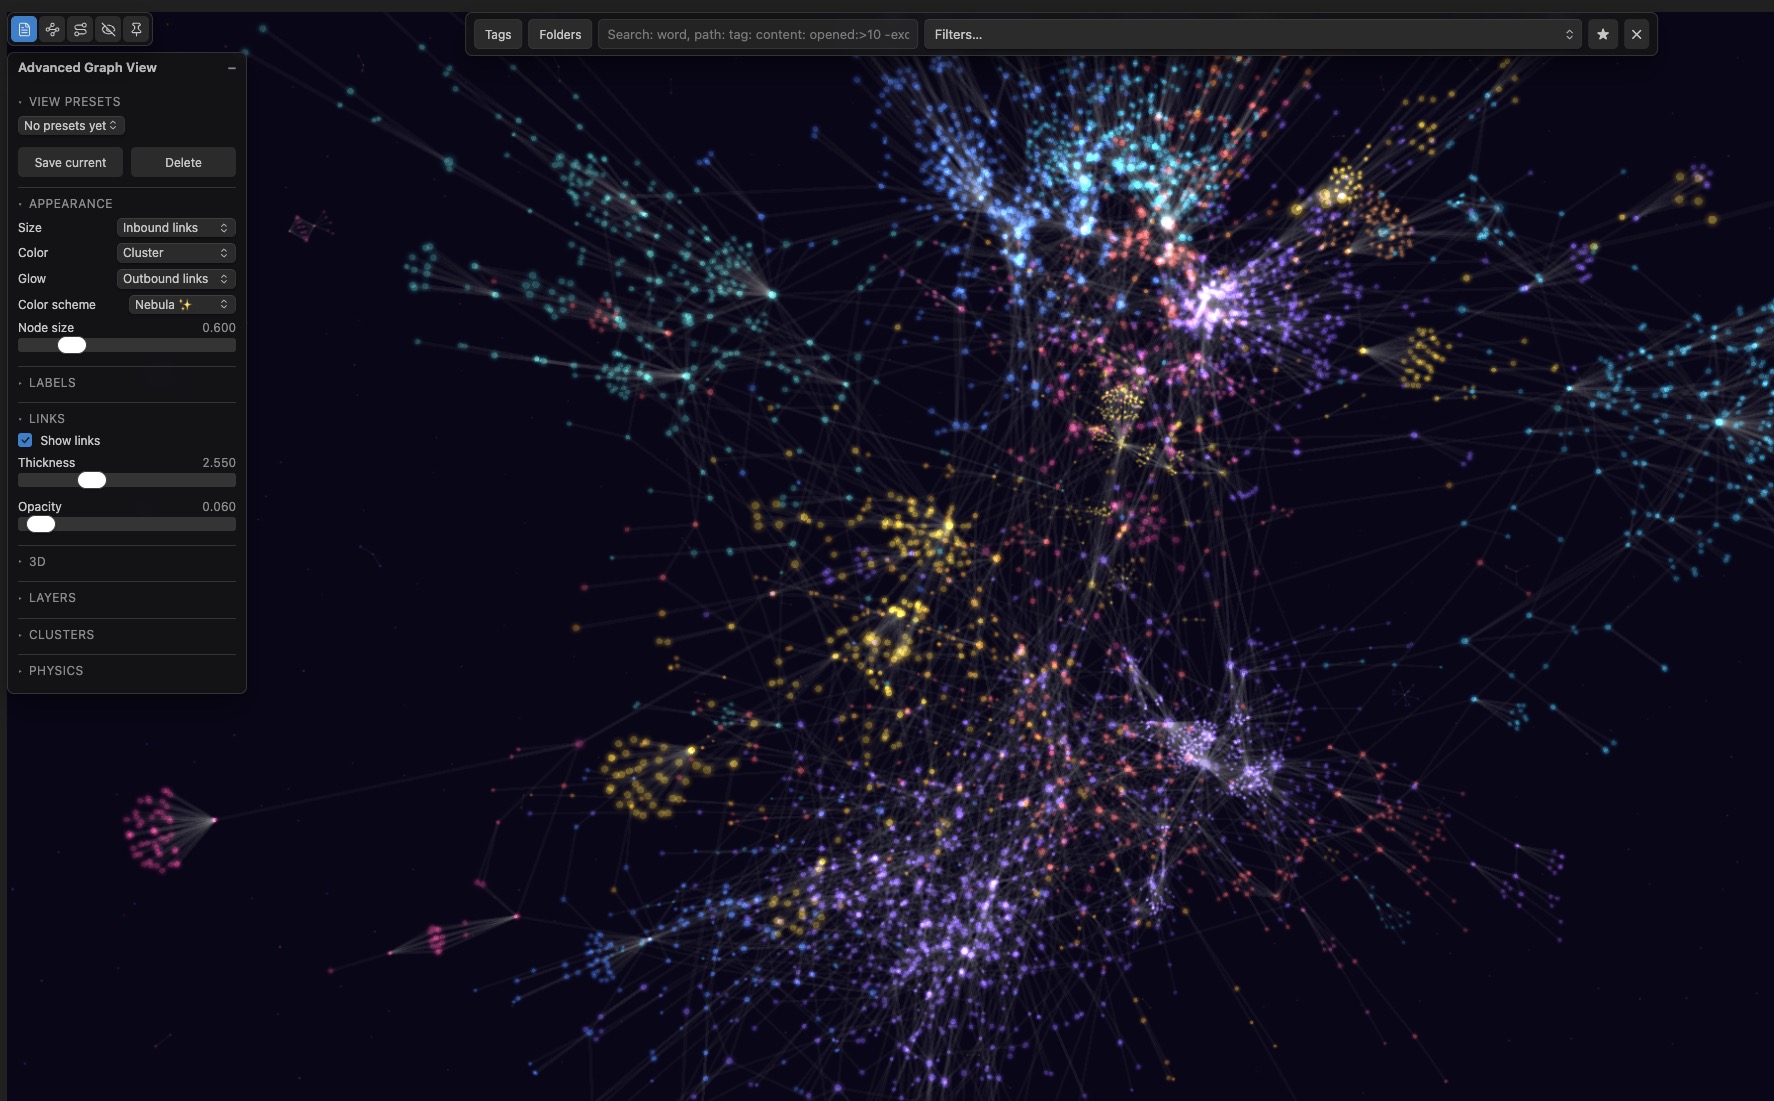
The galaxy color scheme
One of several color schemes — glowing, additive blending, dimmed automatically on light themes so nodes stay visible.
Installation
Not yet in the Community Plugins directory. Two ways in, for now.
BRAT (recommended)
Install BRAT from Community Plugins and enable it. Command palette → BRAT: Add a beta plugin for testing. Paste n23eos/advanced_graph_view and confirm. Then enable Advanced Graph View in Settings → Community Plugins.
Manual
Download main.js, manifest.json and styles.css from the latest release. Put them in <vault>/.obsidian/plugins/graph-insight/ and enable the plugin.
Requires Obsidian 1.13.0 or newer. Open the graph via the ribbon icon or the command Advanced Graph View: Open graph view.
Privacy & network
No telemetry. No analytics. The plugin makes no network requests at all — everything, including your usage log, stays on your machine.